Lyman series
In physics and chemistry, the Lyman series is the series of transitions and resulting ultraviolet emission lines of the hydrogen atom as an electron goes from n ≥ 2 to n = 1 (where n is the principal quantum number referring to the energy level of the electron). The transitions are named sequentially by Greek letters: from n = 2 to n = 1 is called Lyman-alpha, 3 to 1 is Lyman-beta, 4 to 1 is Lyman-gamma, etc. The series is named after its discoverer, Theodore Lyman.
Contents |
History
The first line in the spectrum of the Lyman series was discovered in 1906 by Harvard physicist Theodore Lyman, who was studying the ultraviolet spectrum of electrically excited hydrogen gas. The rest of the lines of the spectrum (all in the ultraviolet) were discovered by Lyman from 1906-1914. The spectrum of radiation emitted by hydrogen is non-continuous. Here is an illustration of the first series of hydrogen emission lines:
Historically, explaining the nature of the hydrogen spectrum was a considerable problem in physics. Nobody could predict the wavelengths of the hydrogen lines until 1885 when the Balmer formula gave an empirical formula for the visible hydrogen spectrum. Within five years Johannes Rydberg came up with an empirical formula that solved the problem, presented first in 1888 and in final form in 1890. Rydberg managed to find a formula to match the known Balmer series emission lines, and also predicted those not yet discovered. Different versions of the Rydberg formula with different simple numbers were found to generate different series of lines.
The Lyman series
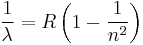
The version of the Rydberg formula that generated the Lyman series was:

Where n is a natural number greater than or equal to 2 (i.e. n = 2,3,4,...).
Therefore, the lines seen in the image above are the wavelengths corresponding to  on the right, to
  on the left (there are infinitely many spectral lines, but they become very dense as they approach to (Lyman limit), so only some of the first lines and the last one appear).
The wavelengths (nm) in the Lyman series are all ultraviolet:
 |
2 | 3 | 4 | 5 | 6 | 7 | 8 | 9 | 10 | 11 |  |
|---|---|---|---|---|---|---|---|---|---|---|---|
| Wavelength (nm) | 121.5 | 102.5 | 97.2 | 94.9 | 93.7 | 93.0 | 92.6 | 92.3 | 92.0 | 91.9 | 91.12 (Lyman limit) |
Explanation and derivation
In 1913, when Niels Bohr produced his Bohr model theory, the reason why hydrogen spectral lines fit Rydberg's formula was explained. Bohr found that the electron bound to the hydrogen atom must have quantized energy levels described by the following formula:
![E_n = - {{m e^4} \over {2 \left( 4 \pi \varepsilon_0 \hbar \right)^2}} {1 \over n^2} = - {13.6 \over n^2} [\mbox{eV}].](/2012-wikipedia_en_all_nopic_01_2012/I/774926300276d043602e76358cc61a37.png)
According to Bohr's third assumption, whenever an electron falls from an initial energy level( ) to a final energy level(
 ), the atom must emit radiation with a wavelength of:
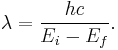
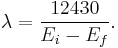
There is also a more comfortable notation when dealing with energy in units of electronvolts and wavelengths in units of angstroms:
Replacing the energy in the above formula with the expression for the energy in the hydrogen atom where the initial energy corresponds to energy level n and the final energy corresponds to energy level m:

where R is the same Rydberg constant of Rydberg's long known formula.
For the connection between Bohr, Rydberg, and Lyman, one must replace m by 1 to obtain:
which is Rydberg's formula for the Lyman series. Therefore, each wavelength of the emission lines corresponds to an electron dropping from a certain energy level (greater than 1) to the first energy level.
See also
External links
|
|||||